ECG Basics EKG
Your online EKG class
This concise ECG Basics course reviews the main features of ECG tracings (ECG interpretation criteria). A method for analyzing ECGs is also presented. This method includes assessment of rhythm, calculating heart rate, observing P-wave forms, measurement of ECG intervals and segments and the evaluation of other relevant waves.Start ECG Basics Short Course
Lessons
Lesson #1: EKG Paper
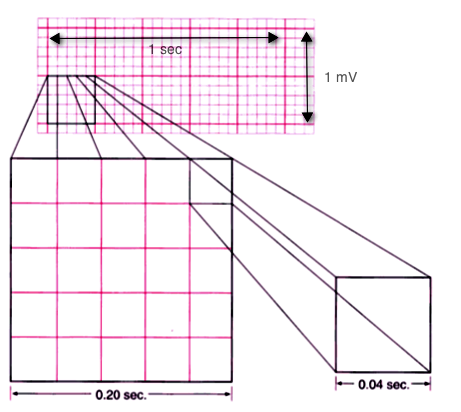
ECG tracings are recorded on grid paper. The horizontal axis of the
EKG paper records time, with black marks at the top indicating 3-second intervals.
Each second is marked by 5 large grid blocks. Thus, each large block equals 0.2 second. The vertical axis records EKG amplitude (voltage). Two large blocks equal 1 millivolt (mV). Each small block equals 0.1 mV.
Within the large blocks are 5 small blocks, each representing 0.04 seconds.
Lesson #2: EKG Nomenclature
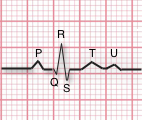
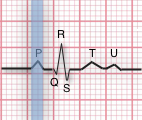
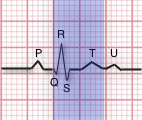
Normal EKG tracings consist of waveform components that indicate electrical events during one heart beat. These waveforms are labeled P, Q, R, S, T and U. The following descriptions are with respect to Lead II.
P wave is the first deflection and is normally a positive (upward) waveform. It indicates atrial depolarization. QRS complex follows the P wave. It normally begins with a downward deflection, Q; a larger upward deflection, R; and then a downward S wave. The QRS complex represents ventricular depolarization and contraction.
T wave is normally a modest upward waveform, representing ventricular repolarization. U wave indicates the recovery of the Purkinje conduction fibers. This wave component may not be observable.
Lesson #3: EKG Interpretation
EKG interpretation should be performed using a standard procedure. For this course, we are using an eight-step procedure:
- Rhythm
- Rate
- P Wave
- PR Interval
- QRS Duration
- T Wave
- QT Interval
- ST Segment
Lesson #4: Rhythm
For ventricular rhythms, examine the R to R intervals on the EKG strip. Calipers or paper marks can be used to fix the distance for one R-R interval and then this distance can be compared to other R-R pairs. Within this web site, you will also be able to use virtual calipers.
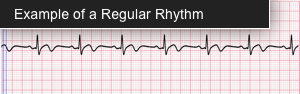
Are they regular, meaning that each heart beat's R-R interval is equal? Small variations of up to 10% are considered equal. Is the rhythm regularly irregular? For example is there a pattern, such as increasing R-R durations? Or perhaps groups of similar intervals as illustrated on the right? Or are R-R intervals completely irregular?
For atrial rhythm, observe the P-P intervals. Are they regular (minor variations can be caused by the breath cycle)? If P-P intervals are irregular, is there a pattern?
Lesson #5: Heart Rate
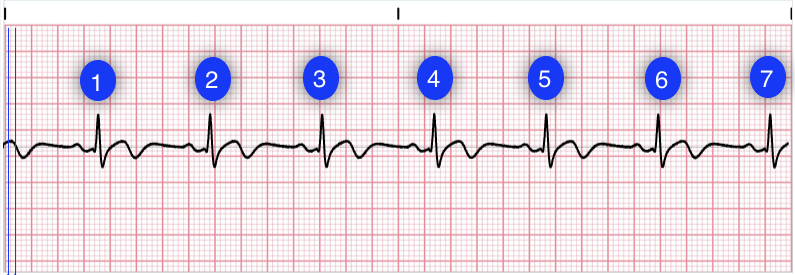
There are several methods for determining heart rate. Our first method is simple. Count the number of QRS complexes over a 6-second interval. Multiply by 10 to determine heart rate. This method works well for both regular and irregular rhythms. In the first image, we can count 7 QRS complexes, so the heart rate is 70.
The second method uses small boxes. Count the number of small boxes for a typical R-R interval. Divide this number into 1500 to determine heart rate. In the second image, the number of small boxes for the R-R interval is 21.5. The heart rate is 1500/21.5, which is 69.8.
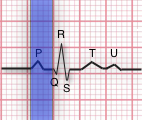
Lesson #6: P Wave
The P wave represents atrial depolarization. This wave is generated by an impulse from the SA node in the right atrium and is conducted across the atria. In a normal EKG, the P-wave precedes the QRS complex. It looks like a small bump upwards from the baseline. The amplitude is normally 0.05 to 0.25mV (0.5 to 2.5 small boxes). Normal duration is 0.06-0.12 seconds (1.5 to 2.75 small boxes). The shape of a P-wave is usually smooth and rounded.
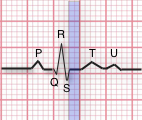
Lesson #7: PR Interval
The PR Interval indicates AV conduction time, from the start of atrial depolarization to the start of ventricular depolarization (the QRS cømplex).
In this step you should measure the interval from where the P wave begins until the beginning of the QRS complex. Calipers, marked paper or counting small boxes methods can be used to determine PR Intervals. Normally this interval is 0.12 to 0.20 seconds (3 to 5 small boxes) in adults, longer in elderly people. This interval shortens with increased heart rate.
Also evaluate if PR Intervals are constant or varying across the EKG strip. If they vary, determine if the variations are a steady lengthening until the point where an expected QRS does not appear.
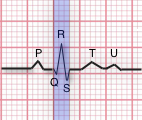
Lesson #8: QRS
The QRS complex indicates ventricular depolarization. Depolarization triggers contraction of the ventricles.
Because of the larger tissue mass, the QRS complex is larger than the P wave. While the prototypical QRS complex consists of three wave components, one or two of these components may be missing.
In this step, measure the QRS duration from the end of the PR interval to the end of the S wave. Use calipers, marking paper or by counting small boxes. The normal range for the qt interval is 0.06 to 0.12 seconds (1.5 to 3 boxes).
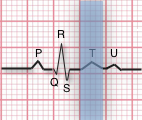
Lesson #9: T Wave
The T wave indicates the repolarization of the ventricles. It is a slightly asymmetrical waveform that follows (after a pause), the QRS complex. Take note of T waves that have a downward (negative) deflection or of T waves with tall, pointed peaks.
The U-wave is a small upright, rounded bump. When observed, it follows the T-wave.
Lesson #10: QT Interval
The QT interval represents the time for ventricular activity including both depolarization and repolarization.
It is measured from the beginning of the QRS complex to the end of the T wave. Normally, the QT interval is 0.36 to 0.44 seconds (9-11 boxes). The QT interval will vary with patient gender, age and heart rate. Another guideline is that normal QT Intervals is less than half of the R-R Interval for heart rates below 100 bpm.
Lesson #11: ST Segment U Wave
The ST segment represents the early part of ventricular repolarization.
The ST segment is the line that from the end of the QRS complex to beginning of the T wave. Normally the ST segment is flat relative to the baseline. An elevated ST can indicate an acute myocardial infarction or other cardiac conditions.
The U-wave is a small upright, rounded bump. When observed, it follows the T-wave. U waves greater than 0.15mv (1.5 boxes) are considered abnormal.
Lesson #12: Quiz Test Questions (Basics)
The ST segment represents the early part of ventricular repolarization.
The ST segment is the line that from the end of the QRS complex to beginning of the T wave. Normally the ST segment is flat relative to the baseline.
Return to Main Lessons Page
Authors and Reviewers
- EKG heart rhythm modules: Thomas O'Brien.
- EKG monitor simulation developer: Steve Collmann
-
12 Lead Course: Dr. Michael Mazzini, MD.
- Spanish language EKG: Breena R. Taira, MD, MPH
- Medical review: Dr. Jonathan Keroes, MD
- Medical review: Dr. Pedro Azevedo, MD, Cardiology
- Last Update: 11/8/2021
Sources
-
Electrocardiography for Healthcare Professionals, 5th Edition
Kathryn Booth and Thomas O'Brien
ISBN10: 1260064778, ISBN13: 9781260064773
McGraw Hill, 2019 -
Rapid Interpretation of EKG's, Sixth Edition
Dale Dubin
Cover Publishing Company -
12 Lead EKG for Nurses: Simple Steps to Interpret Rhythms, Arrhythmias, Blocks, Hypertrophy, Infarcts, & Cardiac Drugs
Aaron Reed
Create Space Independent Publishing -
Heart Sounds and Murmurs: A Practical Guide with Audio CD-ROM 3rd Edition
Elsevier-Health Sciences Division
Barbara A. Erickson, PhD, RN, CCRN -
The Virtual Cardiac Patient: A Multimedia Guide to Heart Sounds, Murmurs, EKG
Jonathan Keroes, David Lieberman
Publisher: Lippincott Williams & Wilkin)
ISBN-10: 0781784425; ISBN-13: 978-0781784429 - Project Semilla, UCLA Emergency Medicine, EKG Training Breena R. Taira, MD, MPH