Left Ventricular Hypertrophy EKG
Your online EKG class
Left Ventricular Hypertrophy
Tech Series
ECG Interpretation
Thomas E. O'Brien
AS CCT CRAT RMA
Objectives
Upon completion of the accompanying narrative and practice, the student will be able to:
- Recall the process for measurement to determine the presence of left ventricular hypertrophy
- Apply the process for measurement to determine the presence of left ventricular hypertrophy
- Determine whether there is electrocardiographic evidence of left ventricular hypertrophy
Analysis of ECGs
People may choose to analyze ECG’s in a number of different ways. The sequence doesn’t necessarily matter as long as you gather and report the proper information each time.
If your protocols are different, always follow them.
Lessons
Lesson #1: Left Ventricular Hypertrophy (LVH)
Intro
Hypertrophy refers to an abnormal thickening of a chamber wall.
Simply put, this abnormal thickening translates to an increase in the voltage of the QRS complex.
The wall thickens due to increased vascular resistance over time

Intro 2
QRS complexes will show greater amplitude (more muscle mass = more electrical activity)
Taller and deeper ventricular depolarization waves will be seen
Remember: Hypertrophy increases voltage – BBB increases duration.
Lesson #2: Determining LVH 1
Step 1
Determining the presence of LVH is a fairly simple and straight forward three-step process.
- Refer to leads V1 & V2
- Measure and select the deepest ventricular depolarization of the 2 views (not including aberrant complexes)
- Measure from the isoelectric line down to the tip of the deepest QS complex.
- Measure from the isoelectric line down to the tip of the deepest QS complex.
- Write this number down
Lesson #3: Determining LVH 2
Step 2
- Refer to leads V5 & V6
- Measure and select the tallest ventricular depolarization of the 2 views (not including aberrant complexes)
- Measure from the isoelectric line up to the tip of the tallest “R” wave.
- Count the number of millimeters (small boxes)
- Write this number down
Lesson #4: Determining LVH 3
Step 3
- Add the 2 numbers together
- If it adds up to 35mm or more, clinically you must suspect left ventricular hypertrophy
Lesson #5: LVH Analysis
Example
- Note the red arrows. The deepest “QS” wave from V1 and V2 has been selected
- The tallest R wave in V5 and V6 has been selected
- What is the total number?
- 37 mm, YES!

Lesson #6: Quick Check 1 321
Tracing
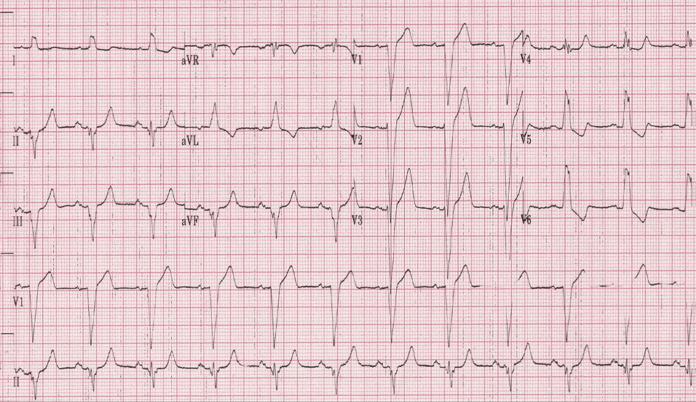
Take measurements for LVH on this tracing, then answer the questions below.
Is LVH present?
Yes
Correct!No
Incorrect.Measurement
What number did you get?
Show Answer
38mmLesson #7: Quick Check 2 321
Tracing
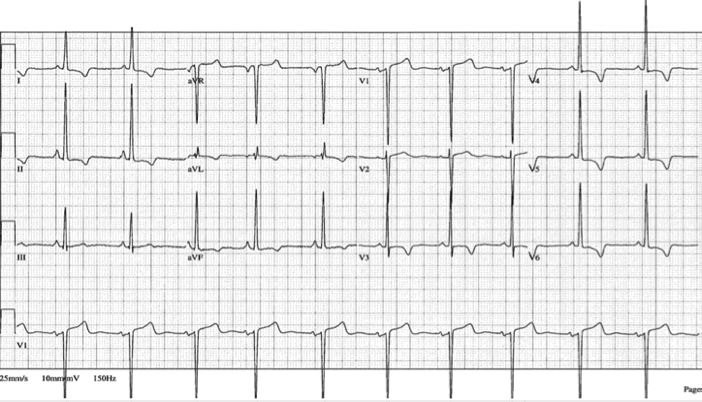
On this tracing, take LVH measurements, then answer the questions below.
Is LVH present?
Yes
Correct!No
Incorrect.Measurement
What number did you get?
Show Answer
58mmLesson #8: Quick Check 3 321
Tracing
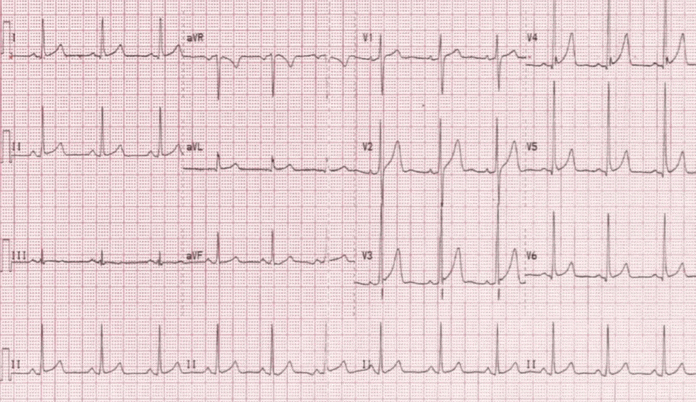
Using the tracing, determine LVH measurements, then answer the questions below.
Is LVH present?
Yes
Correct!No
Incorrect.Measurement
What number did you get?
Show Answer
39mmLesson #9: Quick Check 4 321
Tracing
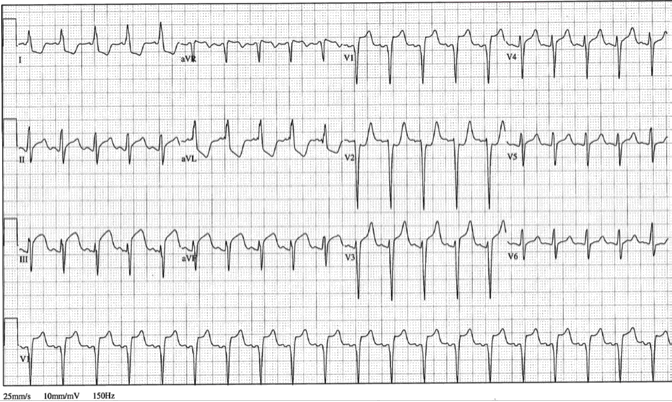
Take LVH measurements on this practice tracing, then answer the questions below.
Is LVH present?
Yes
Incorrect.No
Correct!Measurement
What number did you get?
Show Answer
32mmLesson #10: Quick Check 5 321
Tracing
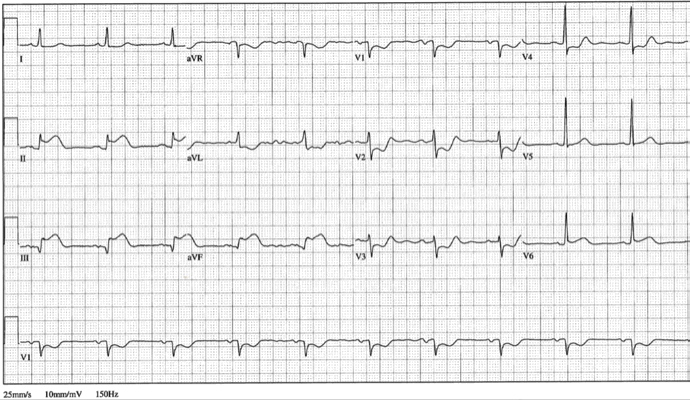
Practice taking LVH measurements on this tracing, the answer the questions below.
Is LVH present?
Yes
Incorrect.No
Correct!Measurement
What number did you get?
Show Answer
24mmReturn to Main Lessons Page
Authors and Reviewers
- EKG heart rhythm modules: Thomas O'Brien.
- EKG monitor simulation developer: Steve Collmann
-
12 Lead Course: Dr. Michael Mazzini, MD.
- Spanish language EKG: Breena R. Taira, MD, MPH
- Medical review: Dr. Jonathan Keroes, MD
- Medical review: Dr. Pedro Azevedo, MD, Cardiology
- Last Update: 11/8/2021
Sources
-
Electrocardiography for Healthcare Professionals, 5th Edition
Kathryn Booth and Thomas O'Brien
ISBN10: 1260064778, ISBN13: 9781260064773
McGraw Hill, 2019 -
Rapid Interpretation of EKG's, Sixth Edition
Dale Dublin
Cover Publishing Company -
12 Lead EKG for Nurses: Simple Steps to Interpret Rhythms, Arrhythmias, Blocks, Hypertrophy, Infarcts, & Cardiac Drugs
Aaron Reed
Create Space Independent Publishing -
Heart Sounds and Murmurs: A Practical Guide with Audio CD-ROM 3rd Edition
Elsevier-Health Sciences Division
Barbara A. Erickson, PhD, RN, CCRN -
The Virtual Cardiac Patient: A Multimedia Guide to Heart Sounds, Murmurs, EKG
Jonathan Keroes, David Lieberman
Publisher: Lippincott Williams & Wilkin)
ISBN-10: 0781784425; ISBN-13: 978-0781784429 - Project Semilla, UCLA Emergency Medicine, EKG Training Breena R. Taira, MD, MPH